Illustrate a client's retirement timeline, portfolio longevity, taxes on withdrawals and protection needs from the assumptions you enter, compare scenarios side by side, and print a client report in your brand — with your name, logo and photo.
Sample household — every figure is worked out from the assumptions entered, and every value can be changed.
Your details, logo and photo stay with the tool, so each new client starts from your own template.
Choose your role, the tabs and planner sections you use, and add your name, firm, contact details, logo and photo.
Enter the client's details and where they are today, calculate the plan, then add plans, cover, portfolio mixes or tax buckets.
Tick the blocks to include, then Print / Save as PDF — with your branding at the top.
The same nine tabs as in the tool. Tap ƒ beside any result to see how it's calculated, and type over any value.
Enter where the household is today — savings, income, expenses, debt, retirement spending, Social Security, pension and health costs — then calculate the plan.
Plan A is the Planner. Plans B and C change only what differs — a blank cell uses Plan A's value.
A needs analysis for the client and the spouse, from the household's numbers and the cover already in place.
Mix A is the current mix, Mix B an alternative — using the return and volatility you set for each asset class.
Pre-tax, Roth and taxable balances, with the ordinary, penalty and capital-gains rates you set — US rules, simplified.
Move a slider and the results update right away, next to the starting plan.
Who the report is for. Personal details each have a “Show on report” switch; age and number of children are always shown.
Choose your role — financial advisor, insurance agent, or both — and the tabs and planner sections you use.
Every block starts ticked. Untick what the client doesn't need, then Print / Save as PDF.
The household's numbers in one document — with your name, logo and photo at the top. Print it or save it as a PDF.
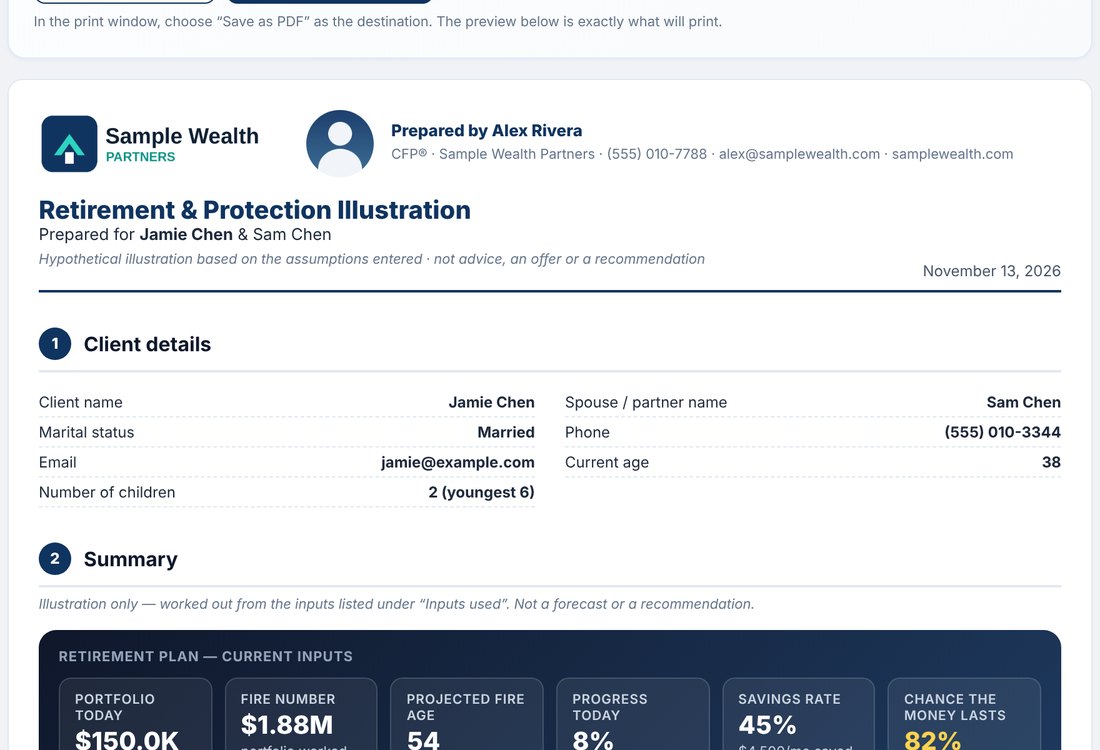
Name, title, firm, phone, email, website, logo and photo — on the report's first page.
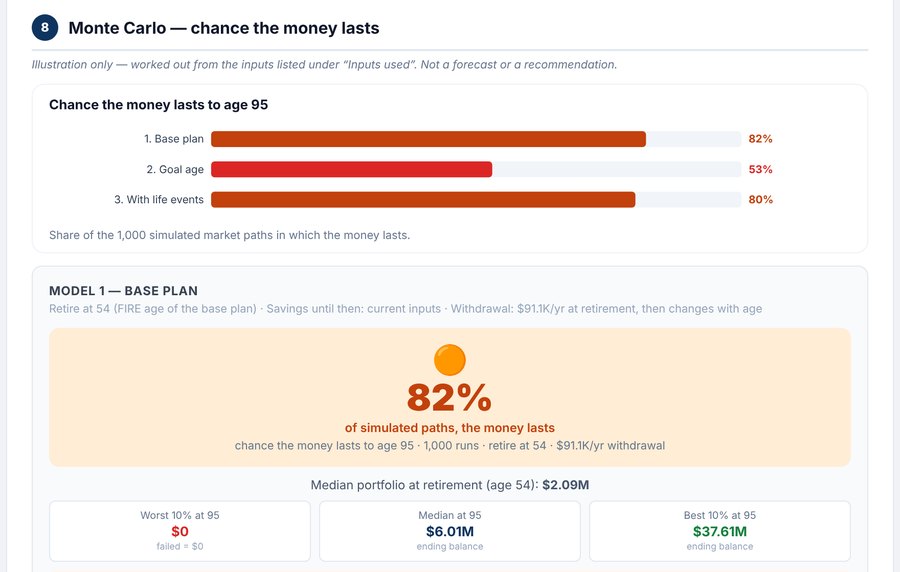
Summary, financial independence plan, plan comparison, goals & life events, Monte Carlo, protection review, portfolio mix, tax-aware withdrawals and more — all ticked by default.
Portfolio growth, cover needed vs cover in place, net worth by age, money left by tax bucket.
An important notice you can edit, with a restore-default button. Inputs used and key assumptions are always listed.
Every version is the same calculator — the same inputs, results, charts and client report. Use whichever you prefer, and keep all three.
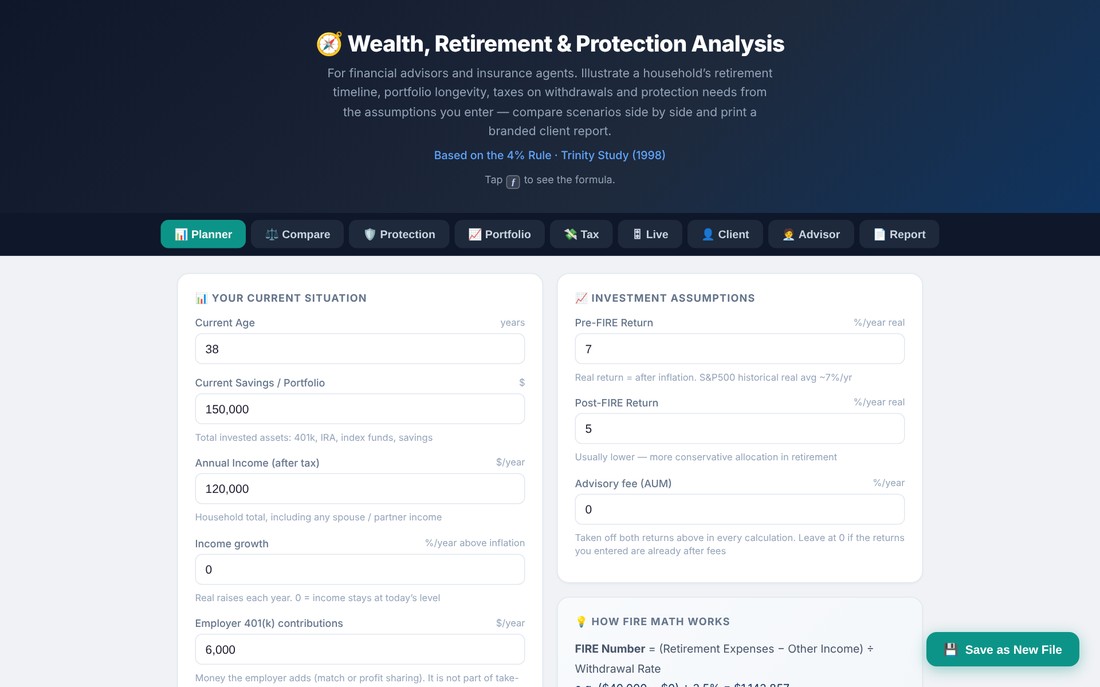
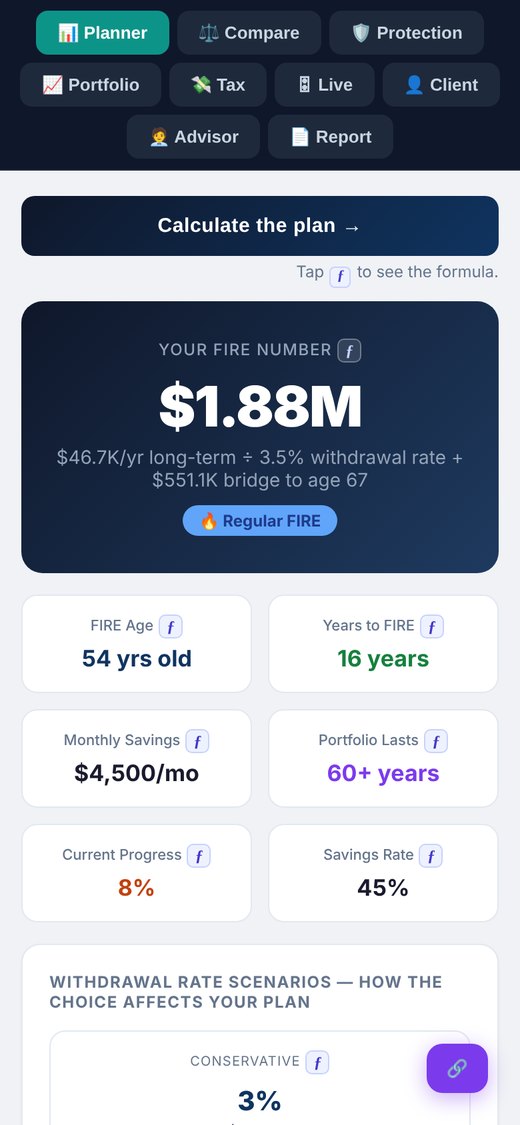
Amounts and start ages, plus a bridge from the FIRE age until benefits begin.
A yearly cost from the FIRE age until Medicare age, added to the plan.
Balance, rate and payment — paid off along the way and counted in the plan.
When saving could stop, and what it takes to reach a target retirement age.
Salary changes, a home, college or a career break — yearly amounts or lump sums.
Base plan, goal age and life events, each run across 1,000 simulated paths.
Family protection, critical illness, income protection and long-term care for the client and spouse.
Pre-tax, Roth and taxable balances, your tax rates and the RMD age.
Useful when a client asks “where does that come from?”
The calculators run in your browser. Inputs, client details and images are not sent to a server.
Buy once and keep using it as rates, rules and costs change — in the web apps and the Excel workbook alike.
Every value starts filled in — type over any of it: rates, costs, limits and tax figures.
Tax rates, Social Security, returns, costs and cover amounts are inputs you set, so each year you simply enter the figures you use — no update needed.
No hard caps — a note appears beside an input only if it's outside a logical limit.
Buy once — both web apps and the Excel workbook are yours to keep.
🔒 Secure checkout via Gumroad · Card or PayPal · Instant download
After checkout you receive the links to both web apps and the Excel workbook.
Financial advisors, insurance agents, and those who do both. You choose your role on the Advisor tab and turn off the tabs or planner sections you don't use.
Every figure is worked out from the assumptions entered and is shown as a hypothetical illustration. The tool calculates and charts — it doesn't make recommendations. You can edit the report's important notice, and restore the default at any time.
No. You run the numbers and share the report with your client as a printed copy or a PDF.
Yes. Returns, volatility, withdrawal rate, tax rates, cover amounts and every other pre-filled value can be typed over by hand.
No. The calculators run in your browser and inputs are not sent to a server. Client details are kept in the file you save (on iPhone and iPad, in your link), and the client roster stays in your browser.
Yes — the same inputs, calculations, charts and client report, as live formulas you can open in Microsoft Excel. Both versions are yours to keep.
The desktop & Android web app works in Chrome or Edge on a computer or Android phone. The iPhone & iPad web app works in Safari. The Excel workbook opens in Microsoft Excel.